home » news » urban planning
Vault 2016: Watch your step
This is one of a series of unpublished posts from late 2016 and early 2017 concerning the safety of streets. I’m resurrecting them for publication as, though some are a bit heavy on stats, they seem more relevant than ever. I’ve tidied them up a little and updated the links, but otherwise they are “as is”.
This is Part 1. The rest will be available here, eventually.
I’m getting a bit tired of being lectured every New Year’s Day, when the figures are in for the previous year, that road users just need to be a bit more careful. Pedestrians get it too, as the number killed and injured edges up year by year. “Don’t use your phone”. “Don’t drink and walk.” “Don’t rush”. “Cross at the lights.” Even “wear bright clothing.” But what if, in the chorus of victim blame, there is something else that goes unmentioned.
Until November, I hadn’t given pedestrian safety a moment’s thought. An increasing number of hairy situations while walking and cycling changed that. I thought a simple question like “are the roads getting less safe for pedestrians” would be quite simple to find an answer to, but no. First, the bigger picture.
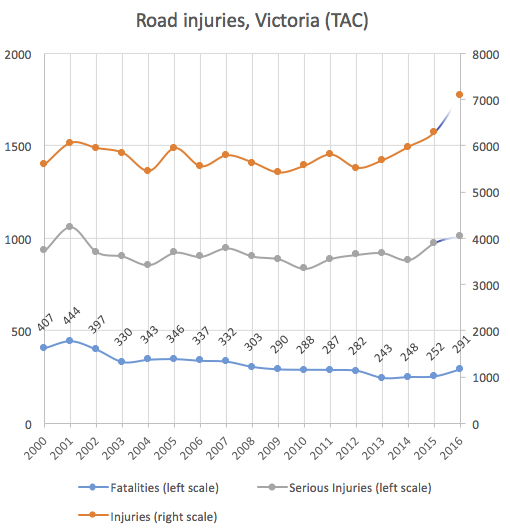
Until 2009, the number of people being killed and injured on the roads was on on the decline. In 2010, injuries started to rise. The following year, serious injuries started to rise. By 2014, the most extreme of injuries – fatalities – began their rise too. At 291, the road toll in Victoria is the worst it’s been since 2008. Injury levels have not been this bad since last century.
Note: This chart shows the injury compensation claims approved by TAC. 2016 injury estimates are correct to June 30th. See TAC caveat at base of article.
With great investment in road infrastructure, behavioural change (alcohol and speeding for instance), and car safety, these raw figures are meant to be dropping. That’s not the case, even when Victoria’s population increases are accounted for. The direction is still upwards, especially for road injury claims approved by the Traffic Accident Commission (the TAC).
For pedestrians, at first glance things look a bit better.
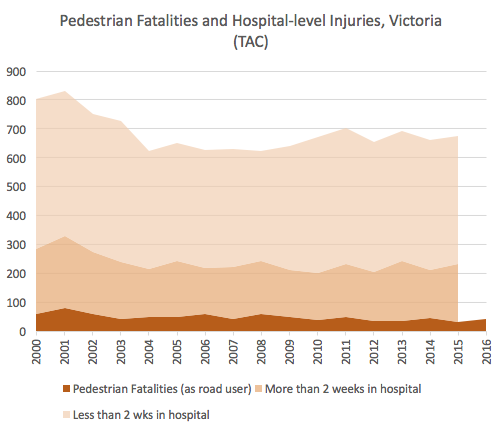
Using the online tools at the TAC, I delved further to find out who is getting injured and when they are getting injured. Firstly, when are these crashes happening?
Although all age groups over 25 are showing rises in daytime injury rates, it’s those over 60 who are bearing the brunt of it, by a long shot. Injuries for them have shot up 58% since 2008. Even when the rising population of seniors is taken into account, there has been a 37% increase.
So what’s causing this surge in elder pedestrian injuries? The daytime risk has shot up in Melbourne but not Country Victoria. From my checks of the four most and least advantaged municipalities in Melbourne, the socio economic status of the area appears to have some influence, poorer areas generally faring much worse per capita from 2009 to 2011, but they have been great improvements since 2012, so this isn’t the current culprit. The recent upsurge seems to be scattered across many municipalities, but without any traceable patterns or traits that I can perceive. One council might have a bad year for over 60s in 2013, then a better year in 2014, but another will do just the reverse. So the bogeyman is hard to pin down as it’s everywhere.
Taking away alcohol (mainly night time), pedestrian distraction (mainly youth), we are left with three factors that could be contributory. Driver distraction is almost definitely a problem, but it can be ruled out from this exercise as it would increase the risk of a crash, and the number of daytime crashes involving old pedestrians is slowly decreasing, according to VicRoads. I think it’s a minor player. The increase in vehicle kilometres travelled can also be ruled out, as those extra kilometres are being driven almost exclusively on freeways. The only chips left in my bag to do with the vehicles themselves. To test this, I had to trawl the VicRoads crash database ( see caveats at end of post).
After a lot of work connecting accident data with vehicle data and then with age data, I classified each vehicle involved in 60+ morning pedestrian crashes which were fatal or serious. Here’s the proportion of new vehicles ( less than 6 years old) to old in morning pedestrian crashes ( for pedestrians aged 60 or over ).
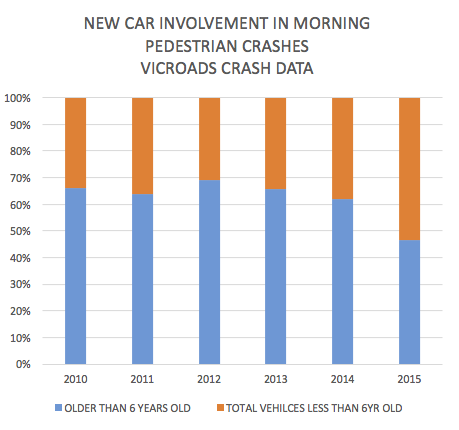
This might mean that people are renewing their cars more than they were, but I doubt it. Here’s a breakdown of all “struck pedestrian” crashes in 2015, by vehicle class.
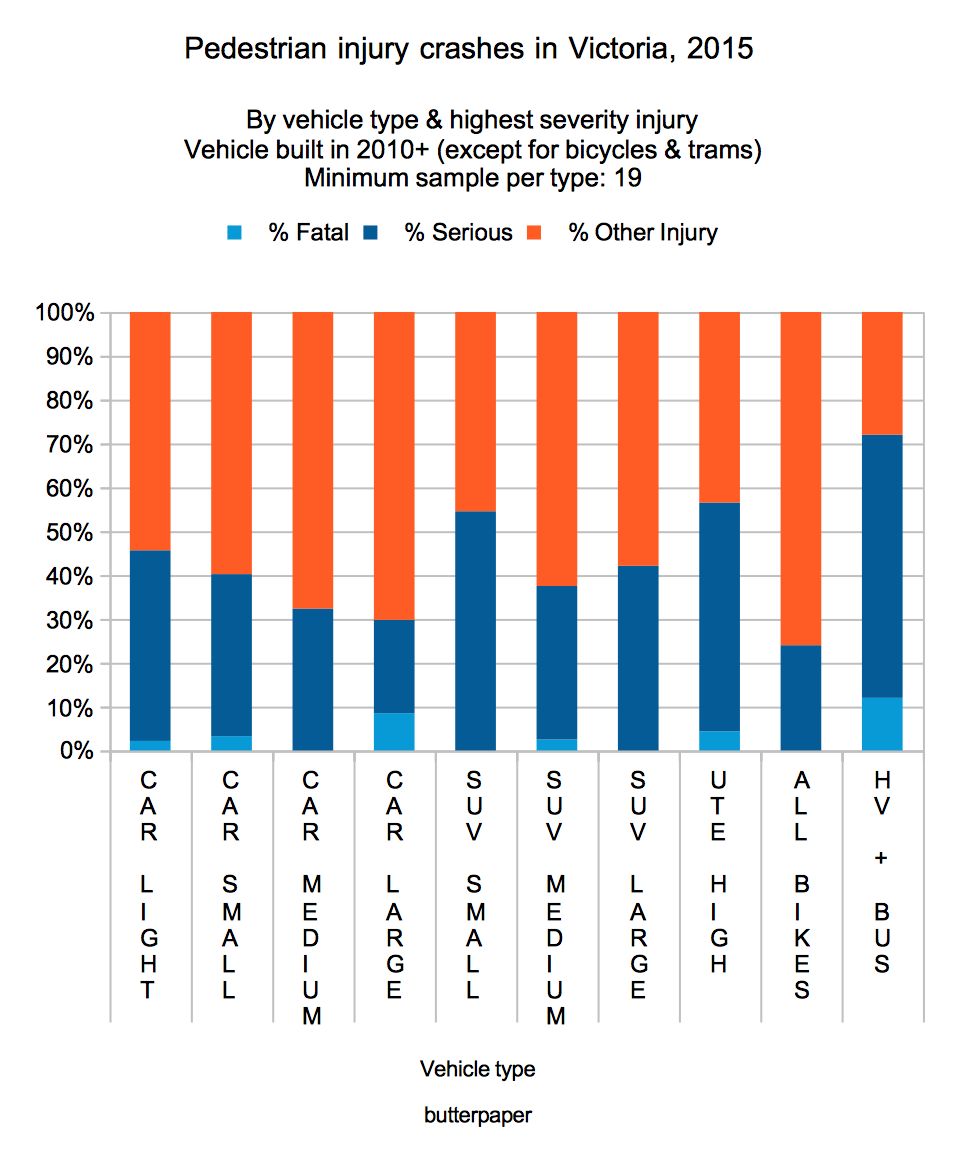
This chart makes sedans look like the heroes of the road. But are compact cars and small SUVs really that dangerous on the road? I added up the figures for any vehicle model built since 2010, where more than 20 have been involved in “struck pedestrian” crashes since 2010.
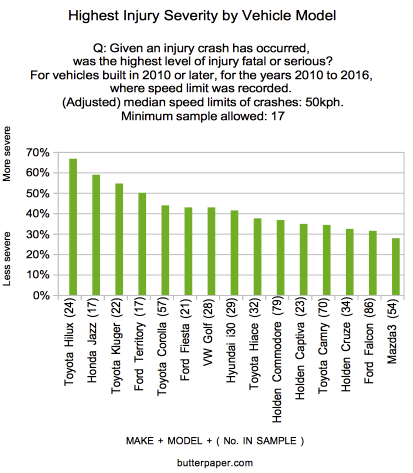
The vehicle models selected are those built in 2010 or later that have been involved in more than 20 “struck pedestrian” crashes with police-reported injuries since 2010. The percentage figures are the proportion of injury crashes where someone died or was seriously injured (sent to hospital).
I worked back even further, to vehicles built since 2004, and found the same pattern. I think, to be on the safe side, don’t cross the road in front of a heavy, tall or light vehicle. Wait for that increasingly rare sedan, with a low and long bonnet to catch your fall – the others are more likely to send you sprawling to the ground, and even underneath the vehicle.
I think this is how we can be having fewer pedestrian accidents of a more severe nature. SUVs are now selling in almost the same numbers as traditional passenger cars. The Toyota Hilux, a very tall pickup, was the most sold vehicle in Australia last year. Since last year, it’s had a five star safety rating – even with bullbars fitted. Those ratings are another long story.
As most deaths and injuries on the road occur in single vehicle accidents (like running off the road), the safety of a car’s occupants is seen as paramount.
I’ll leave you with a couple of pertinent quotes buried in reports from the Monash University Accident Research Centre.
“… the odds of [ pedestrian ] death or thoracic [ chest ] injury is 74.4% higher for large SUVs compared to large cars… The results suggest that the increasing popularity of vehicles such as SUVs has the potential to lead to an increase in the level of pedestrian road trauma.” Newstead et al (MUARC) abstract, Melbourne 2015
“The proportions of unprotected road user (motorcycle, bicycle and pedestrian … ) crashes were greatest in Victoria. These crash types were most prevalent in the people-mover, van, and medium and large SUV market groups.” MUARC report 329, Melbourne 2015, p32
What might we do?
- Reduce built-up area speed limits from 60/50/40 to 50/40/30.
- A tricky one in Australia, but metal bullbars should be pedestrian tested and should not available to any driver wanting one.
- Outlaw imported factory-installed tints (“privacy glass”) that is darker than the local law permits.
- For a five star safety rating, require either AEB-P (automatic braking for pedestrians) or pedestrian airbags in all new vehicles.
- A public awareness campaign to overcome the common misconception that drivers pay for the roads through their registration fees, and therefore own them.
- Encourage office fleet policies banning light cars, SUVs and high utes (as the TAC’s purchase policy effectively does).
- Prevent the importation of passenger vehicles with a pedestrian protection ration of “marginal” or “poor”.
- Fix the VicRoads crash datasets. Research propositions would be easier to confirm or deny if the base information was more accessible and consistent.
Main data sources and caveats
TAC TAC figures are only for injuries resulting in successful claims. No information is available for ineligible injury claims. Neither do TAC figures include those not injured enough to warrant a hospital’s attention. For a rough guide (from Vicroads), the total number of injuries per year for all road users is about 17,000.
Vicroads The Vicroads database is a much less reliable beast than TAC’s. It relies on police-recorded notes from an accident site. They’re not thinking too much about statistical analyses when mopping up after a crash, so over and under-reporting is rife. For pedestrians and cyclists, I think the problem is under-reporting. Another issue is that the Vicroads crashes database isn’t linked to the TAC injuries database, so it’s virtually impossible to connect the dots through to the hospital outcome, unless a death is involved. Yet another problem is that the police and the TAC have a very different idea about what constitutes a “serious injury”. A Victorian parliamentary inquiry examined this tangle for two years, but its report, published in 2014, was ignored by the incoming state government.
VicRoads “interactive crash application”:https://www.vicroads.vic.gov.au/safety-and-road-rules/safety-statistics/crash-statistics
Method
The TAC data could be used without much fiddling. With the Vicroads data, the information was scattered into separate spreadsheets. I categorised all the reported vehicle models into categories then fed everything into a custom SQL database. From there I could dial up reports that cross-referenced vehicle information with accident information, using the accident ID as unique identifier.
Posted by Peter on 15.03.25 in urban planning
tags: cars, streets of our town, vault
comment
Commenting is closed for this article.
-
 Vault 2007: Pricey digs and votes
15.04.25 in news -
 Vault 2016: Streets of our town - staying on your feet
16.03.25 in news -
 Vault 2014: Gaza - cities under siege and under attack
29.03.24 in news -
The missing link
20.08.13 in news -
Sprawling from Grace: The Consequences of Suburbanisation
27.01.13 in resources -
Fat house, fat car
23.05.10 in news -
 New town, old ideas?
13.04.10 in news -
Bad Subjects: The Congestion Coalition?
15.09.08 in resources