home » news » urban planning
Vault 2016: Streets of our town - staying on your feet
This is one of a series of unpublished posts from late 2016 and early 2017 concerning the safety of streets. I’m resurrecting them for publication as, though some are a bit heavy on stats, they seem more relevant than ever. I’ve tidied them up a little and updated the links, but otherwise they are “as is”.
This is Part 2. The rest will be available here, eventually.
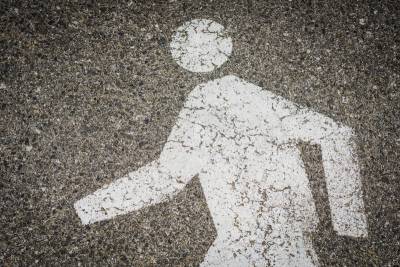
Pedestrians are suffering on the road more than they should be because of a gap in jurisdictions. Vehicle safety is the priority of road safety authorities. Traffic flow is the priority of traffic engineers. Pedestrians are difficult moving targets. Their manufacturers never update their safety features, and they are prone to unexpected changes in direction. Registration is not required to walk, and neither are helmets (yet).
There has been much work done to bring less-abled people equity on the footpaths, but the thought that pedestrians should have equity with vehicle drivers doesn’t compute – they are too incompatible. Unfortunately the safety gap between the two groups is growing.
It’s usually drivers who suffer the most from vehicle crashes. Unsurprising, as drivers are usually alone in their cars. When the field is narrowed – to Victorian metropolitan roads with a speed limit 50kph or less (2011 – 2015) – pedestrians come a very close second. The most dangerous time to be a pedestrian is at 3pm – and even at the other end of the school day more pedestrians and cyclists are seriously injured or killed than drivers.
Australia
Research focused on pedestrian safety in Australia is patchy – infrequent and uncoordinated. Frustrations were recently vented by trauma surgeons in Melbourne, who had identified that while the overall road toll had dropped, pedestrians and cyclists were appearing just as often, with more severe injuries than before. They measured what they could, published the results, and The Age reported on it with a needlessly misleading and inflammatory headline.
“Drunk cyclists and pedestrians could be causing scores of car crashes every year” The Age 02.12.16
The Daily Mail read The Age story and proceeded to mangle it even further.
“Push to make it illegal to drink and WALK – because alcohol-fuelled pedestrians cause a high number of dangerous car crashes” Daily Mail 03.12.16
Meanwhile back in the real world, the actual report found that a quarter of pedestrians carted to the Alfred Hospital with severe injuries had over 0.05g/100 ml blood alcohol concentration (the maximum for drivers, but quite legal for walkers). In Monash University’s news report, Professor Peter Cameron, Academic Director of the Alfred’s Emergency and Trauma Centre, had some constructive advice.
“Barriers separating pedestrians and roadways outside hotels and venues where people drink could be mandated. I guess the more important thing is a public education campaign saying that if you’re intoxicated you should stay away from roads,” he said.
His suggestions fall within the gamut of what I’ve found in the various American and Australian papers. Namely:
- deter drunk people from walking near roads
- deter drunk people from getting drunk
- deter pedestrians from dressing in dark clothes
- separate pedestrians from traffic
- slow the traffic down where pedestrians are
Only the last has a hope in hell. Only the last hints that drivers too might have a role in lowering pedestrian fatalities, that it might not be the pedestrian who is the problem. A Chicago writer looked at some local pedestrian and cyclist tragedies and the way they were played out in courtrooms and newspapers. He then asked:
“So how can we get the public to stop automatically blaming vulnerable road users when drivers run them over? “
He thinks we need a bit of a mindset reset – which is best done by asking the journalists to reconsider how they write. For instance, instead of writing in a dehumanised passive, “a pedestrian was hit by a car which had mounted the footpath” a journalist might write something like, “a Ford Falcon being driven by a local man, 29, mounted the footpath and killed a 30 year old woman.”
As vehicles have become safer for their occupants, serious injuries and deaths for pedestrian have remained about constant. In the U.S., which has the vehicle mix Australia is heading for, the news is worse.
“From 2009 to 2014, the number of pedestrian deaths increased 19 percent, while other motor vehicle crash deaths declined by 4 percent.” IIHS FAQ
2015 was even more of a disaster for pedestrians in the U.S., with fatalities up 10% on 2014. At 5719 deaths, the 2015 figure is the highest since 1996. This recent deadly trend follows a constant decrease in pedestrian fatalities since 1975.
The Insurance Institute of Highway Safety (U.S.) seems a little annoyed with pedestrians (possibly something to do with the IIHS being fully-owned by U.S. auto insurers). It says that 35% of dead pedestrians over 16 had more than 0.08% blood alcohol, and that they were usually “at fault.” They don’t mention that this figure of 35% has hardly changed in the last two decades. The IIHS advocates for separation of traffic and pedestrians through “car is king” solutions such as underpasses, overpasses and even roundabouts. It’s very mid-last-century.
The crash data available at the U.S. Center for Disease Control reveals that the increase in pedestrian deaths is almost wholly restricted to the baby boomer generation, now ageing fast and turning what was once a population “pyramid” into a population skyscraper.
Down towards the bottom of the pyramid, youngsters are the only group to register a steep decline in fatalities. Some experts [ed: links since lost] think this is because a good number of richer kids have left the footpaths, having been given refuge high off the ground in people movers and SUVs. They also think this is one of the reasons pediatric obesity is on the rise.
The IIHS found that the per capita pedestrian death rate for children under 13 had decreased 25% between 2009 and 2014, which they attributed to children walking less.
The afternoon school pick-up run in Melbourne has created a rush hour larger than the one at the end of the work day. Parents are driving their kids to school for a host of not always avoidable reasons, distance and work commitments in particular, but many of these trips are avoidable. The U.K.‘s Living Streets charity claim that their WOW programme results in 30% fewer cars at the school gates.
The change in mindset required to lower pedestrian fatalities seems to be beyond many traffic engineers, though things are starting to shift, where there is the political willpower. As part of New York’s five borough “Vision Zero” initiative, Brooklyn Mayor Bill de Blasio launched his city’s Pedestrian Safety Action Plan last year.
“Traffic crashes can claim the lives of anyone in New York City. They kill people who drive and those who bike, but overwhelmingly, the deadly toll is highest for pedestrians. This Plan acknowledges this injustice toward pedestrians and the synergies that can be realized by improving pedestrian safety for overall traffic safety, well-being, and urban livability.” Bill de Blasio, Mayor of Brooklyn, 2015
Cars
American car design has never had to cater to pedestrian safety. There was a brief attempt to legislate something in the early 1990s but it came to nothing. Responsibility for pedestrian safety has been farmed out to local authorities, and only in the last year has a national response been reconsidered, in light of increasing pedestrian fatalities despite reductions in the overall road toll. Pedestrian protection standards for vehicles are expected to be introduced in 2019 in the States. Don’t hold your breath. This mysterious 30 year delay hasn’t been all bad – it has worked very well for the development of the SUV.
Claire Simms, 2013
“When pedestrians are struck by taller vehicles such as SUVs or pickup trucks, the impact is higher on the body. Typically, larger vehicles mean more serious injuries and higher risk of death.” IIHS FAQ
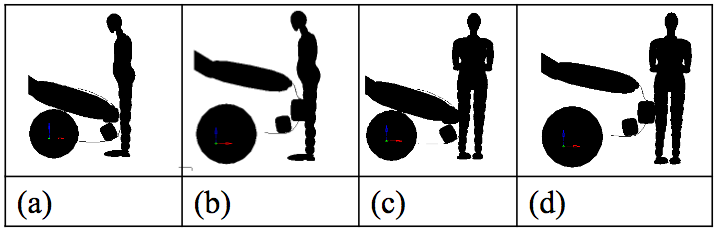
As bumpers and front grilles are higher on SUVs, pedestrians come off none too well when struck. Two 2004 studies found the likelihood of death or severe injury to be three2 times higher than if a car had been involved. This effect is most pronounced in slow traffic, where the pedestrian is more likely to end up under the car. Unfortunately this happens to be the streets where pedestrians lurk.
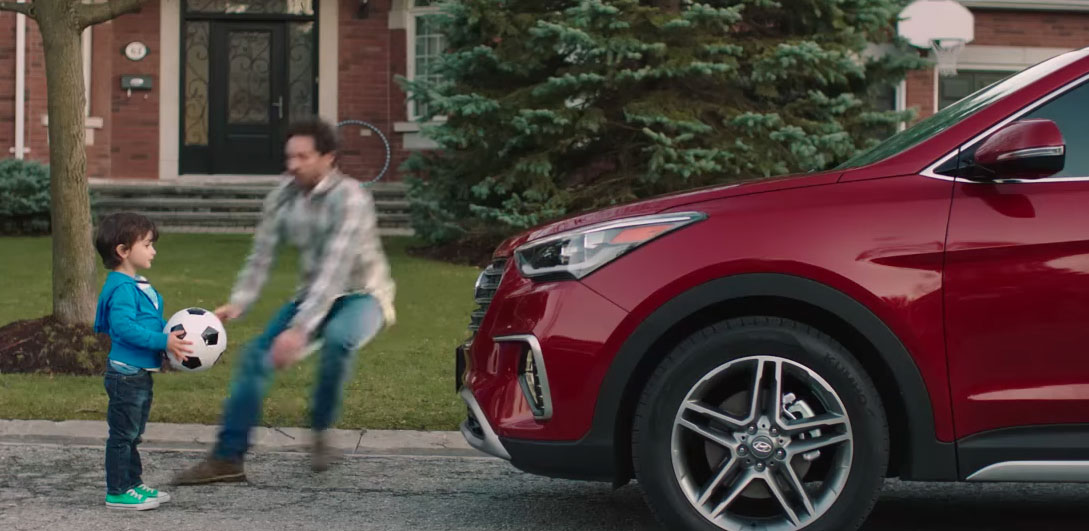
Canadian Hyundai ad – ill-conceived?
“Overall, the risk of pedestrian fatality is 18% to 29% higher with elevated-body vehicles (sport utility vehicles, pickup trucks, vans) than with passenger cars. Sport utility vehicles are especially dangerous for children. When children in the 4 to 7 and 8 to 15 year age groups were struck by an SUV, the relative risk of death was 87% and 46% higher respectively, than if the vehicle had been a passenger car. Sport utility vehicles and pickup trucks are also more likely to cause severe injuries to children than are passenger cars. When hit by an elevated vehicle, children are often thrown forward or knocked to the ground and run over instead of rolling up onto the vehicle’s hood as an adult would do. This may explain why, compared with adults, children are at greater risk of death when hit by an elevated vehicle.” Pediatrics Vol. 124 No. 2 August 01, 2009
View lines
The shape and height of an SUV also makes it harder for a pedestrian, particularly a child, to see over or through one to oncoming traffic. The trend towards high rear windows and thick rear pillars also makes it more difficult for drivers to see out the back, as this video illustrates. American data suggests that most backover accidents occur on private property and involve big vehicles with large blind spots. In 2013, almost half of the victims were under five years old.
Rear video cameras help but research is lacking on its effectiveness, and there are concerns about the poor depth perception provided by a screen compared to a mirror. After six years of advocacy by Kids and Cars and Consumer Reports, the U.S. recently required all automakers to fit rear cameras to new cars by 2018. No similar regulation is on the horizon in Australia, but consumers can consult the NRMA’s Reversing Safety Index. The only SUVs to score more than 1.5 out of 5 have manufacturer fitted reversing cameras.
On city streets, as cars have gained in safety, pedestrians have lost it.
The Case Study Jeep
The Jeep Grand Cherokee scores 5 stars in the NMRA’s reversing visibility tests and the maximum 5 stars in Australian ANCAP ratings, which include a “pedestrian protection” component. You’d think that the car was as good as it could be.
And yet… the Grand Cherokee only scores 16.1 out of 36 for pedestrian protection. On the score card, that translates to “marginal” safety, which was once sufficient for a five star score, but no longer is. Looking at ANCAP’s minimum requirements table, the Jeep should really only have a three star rating this year, slipping to two next year. It’s able to slip through the net is that there are several out clauses. From what I can fathom of the fine print, the 2017 Jeep will retain its old rating because it is not a “new model” as defined by ANCAP. If so, it’s hardly clear to the consumer that their new 2017 Jeep was rated in 2013 to now obsolete standards. They just see this:
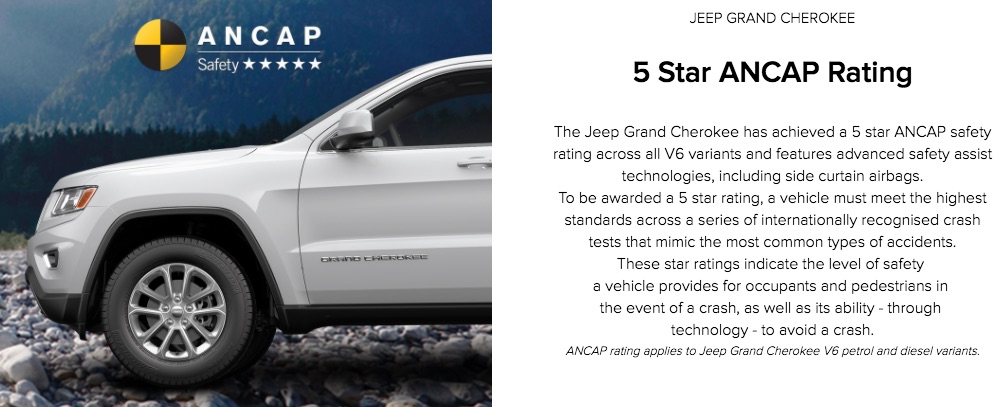
Australian Jeep website, safety section
The “How Safe is Your Car?” ratings for secondhand vehicles are based on crash data, and focus solely on driver safety [ed: thankfully this has changed since 2017]. The older Grand Cherokee model, sold between 1999 and 2005, scores five stars in the 2016 Used Car Safety Ratings, even though the pedestrian protection rating for that model was zero – as bad as it can get.
“The Jeep Grand Cherokee scored no points for pedestrian protection and has been awarded zero stars in that category.” EURO-NCAP 2005 rating
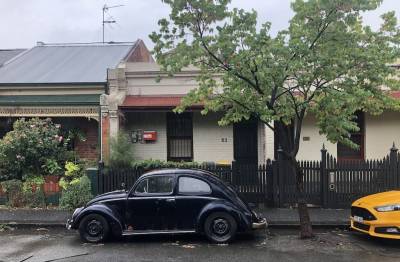
The situation is perverse at the moment. Buyers are favouring “safer” SUVs even though they are making the roads more dangerous for everyone. An SUV’s safety is not so much due to itself as to the lesser size of the vehicles around it. As the SUV shape becomes the norm and cars as we know them leave the road, the SUV driver’s perceived safety will decrease. The only way then is up. Some compare the situation to the arms race.
It’s a race that pedestrians are unable to respond to, unless they wear very high platform shoes. For most, it will just get more and more dangerous to set foot on the street.
Speed
The University of Adelaide’s Centre for Automotive Safety Research, who perform ANCAP’s pedestrian crash tests, analysed from Tasmania from 2001 onward. They noted decreases in deaths and serious injuries in all crash types except those involving elderly drivers, motorcycles, cyclists and pedestrians. All of these registered increases since 2007 of ten to twenty percent.
The quickest way to lower these is obvious but unpalatable to many. In a collision between a pedestrian and a car, UACSR wrote that the “speed above which likelihood of death increases dramatically” is 30kph. The norm in built-up areas in Australia is 50kph, dropping to 40kph outside schools and in heavily pedestrianised city streets. Melbourne’s CBD has had a blanket 40kph speed limit since 2010, though the RACV objects to it. “It’s just not fair on the motorist to have this blanket application of 40 zones when they’re not justified,” said the RACV’s public policy general manager last year.
“Our understanding of the role of speed in injury outcomes has increased significantly over the past decade and it would be fair to say that current speed limits would not have been set as high if this knowledge existed over 60 years ago. In the same way that the community respects changes to practices in relation to smoking and asbestos, speed should also be reviewed on the basis of
increased knowledge.” CASR 2016
1 The price of petrol – past and future – Assoc Prof Adam Pekol, 2010, pdf
2 Two studies: http://tripp.iitd.ernet.in/course/lecture2013/simms [dead link] ; Also: Injury Prevention 2004;10:154–158
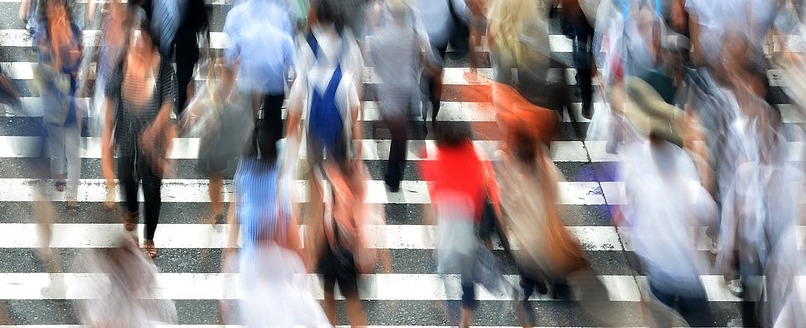
Image source: pixabay
Posted by Peter on 16.03.25 in urban planning
tags: cars, streets of our town, vault
comment
Commenting is closed for this article.
-
 Vault 2007: Pricey digs and votes
15.04.25 in news -
 Vault 2016: Watch your step
15.03.25 in news -
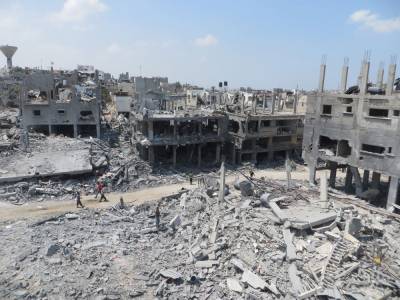 Vault 2014: Gaza - cities under siege and under attack
29.03.24 in news -
The missing link
20.08.13 in news -
Sprawling from Grace: The Consequences of Suburbanisation
27.01.13 in resources -
Fat house, fat car
23.05.10 in news -
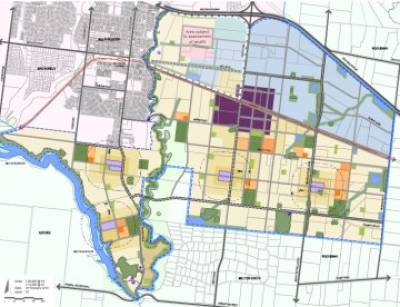 New town, old ideas?
13.04.10 in news -
Bad Subjects: The Congestion Coalition?
15.09.08 in resources